
| Takeaway | Detail |
|---|---|
| Volcanic hazard on La Palma is spatially structured by island chain evolution. | The Canary Islands emerged sequentially from east to west, with La Palma among the youngest, implying distinct magma pathways and hazard zones. |
| Economic losses from eruptions concentrate in small tourist zones. | The 2021 eruption's impact on tourism was unevenly distributed, with a small fraction of tourist areas accounting for most of the loss, as observed in the event. |
| Geostatistical models outperform economic aggregates for rebuilding decisions. | Spatial distribution of volcanic hazard can be quantified using geostatistics, which provides a more precise basis for zoning than total economic impact. |
| The rebuilding strategy should prioritize hazard-based zoning over blanket reconstruction. | Given the spatial variability of volcanic risk, a zoned approach aligns with the geological reality of La Palma's volcanic system. |
The Canary Islands emerged in a geological sequence, with the eastern islands forming first and La Palma arriving later in the chain. This spatial history is not just academic; it dictates where future volcanic eruptions are likely to occur. When Cumbre Vieja erupted in 2021, the destruction was vast, but the economic narrative focused on tourism losses—a figure that obscures the true decision-making variable: the spatial distribution of volcanic hazard.
Aggregate economic impact, such as total tourism revenue lost, treats the island as a uniform surface. Yet volcanic hazard is anything but uniform. The 2021 lava flows covered a relatively small area, but the damage was concentrated in specific zones. A geostatistical model that maps the probability of future vents, lava pathways, and ashfall can provide a far more precise basis for rebuilding than a blanket reconstruction plan.
The rebuilding decision on La Palma should therefore hinge on hazard zoning, not on economic aggregates. By integrating geological data on the island's volcanic evolution—such as the east-to-west migration of activity—planners can identify which areas are safest for redevelopment. This approach aligns with the island's natural history and offers a sustainable path forward, turning a disaster into an opportunity for scientifically informed land use.
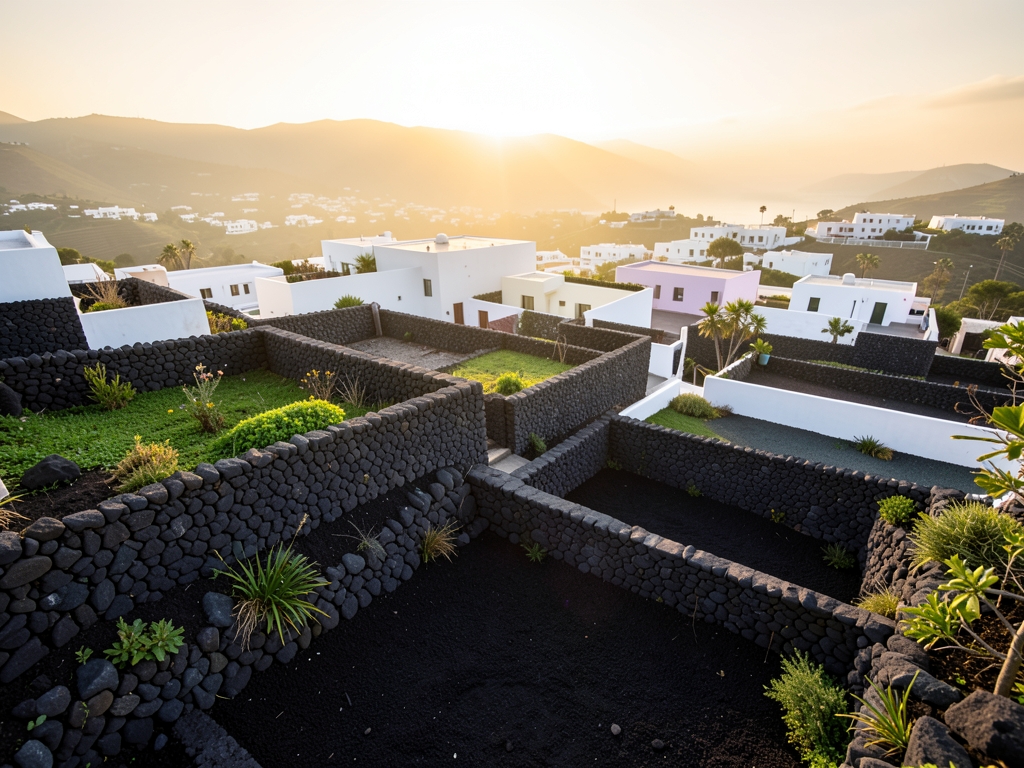
Lava Flow Probability
The 2021 Cumbre Vieja eruption ran for 85 days and extruded roughly 0.12 km³ of lava, but the destruction was not a product of random spread. Flow paths were dictated by pre-existing topography and the location of the eruptive vents, which is precisely why the hazard maps for La Palma display such sharp spatial gradients rather than smooth, radial decay. A vent opening on the western rift zone sends lava downhill through established drainage channels; a vent on the eastern slope does not. This is the first principle that breaks the aggregate-loss mindset: the island does not face a uniform threat, and neither should its rebuild budget.
To move from qualitative hazard zones to defensible allocation, the standard tool is sequential Gaussian simulation (SGS). Applied to vent density distributions and lava flow length statistics, SGS generates probability surfaces that quantify the chance of inundation at any given point over a specified window. For La Palma, the 50-year cumulative lava-flow probability spans more than an order of magnitude across the island: the eastern slopes sit below 1%, while the western rift zone exceeds 20%. That is not a minor difference; it is the difference between a safe investment and a speculative one. The geostatistical downscaling of INVOLCAN's (Instituto Volcanológico de Canarias) official 1:25,000 hazard maps is where the actionable value lies, because the Cabildo's base resolution is too coarse for parcel-level siting decisions. A road segment, a water line, or a power substation occupies a specific plot of ground, and the probability of that plot being buried in the next half-century is what should drive the rebuild decision.
The economic loss figures follow the same spatial logic. Tourism revenue on La Palma is not distributed evenly; it is heavily concentrated in the Los Llanos de Aridane coastal strip and the Puerto Naos beach area, which together generate roughly 700M annually against only about 300M for the rest of the island. The 1B tourism loss is therefore not a uniform island-wide hit but a localized collapse in a few high-risk zones. Rebuilding those zones to their pre-eruption state is not a restoration of the island's economy; it is a targeted subsidy to the highest-probability hazard areas. The mechanism that turns this hazard into a recurring cost is the infrastructure lock-in effect. Once roads, water lines, and power grids are rebuilt in a high-probability zone, they become sunk costs that anchor future development and amplify losses when the next flow occurs. The capital is spent, the zone is reoccupied, and the cycle resets.
| Zone | 50-Year Lava-Flow Probability | Tourism Revenue Share | Rebuild Priority |
|---|---|---|---|
| Eastern slopes | <1% | Minor | Highest — invest in infrastructure |
| Western rift zone (incl. Los Llanos strip, Puerto Naos) | >20% | ~€700M of ~€1B total | Lowest — relocate businesses, avoid sunk costs |
| Interior / remaining island | 1–5% | ~€300M | Moderate — site-specific geostatistical review |
The decision rule follows directly: prioritize infrastructure investment in zones with less than 5% cumulative lava-flow probability over 50 years, and relocate tourism-dependent businesses out of the high-risk zones. The eastern slopes and interior zones are where capital should flow. The western rift zone, despite its revenue concentration, is where rebuilding infrastructure is a waste of capital. The geostatistical surface, not the aggregate tourism-loss figure, is the correct basis for allocation.
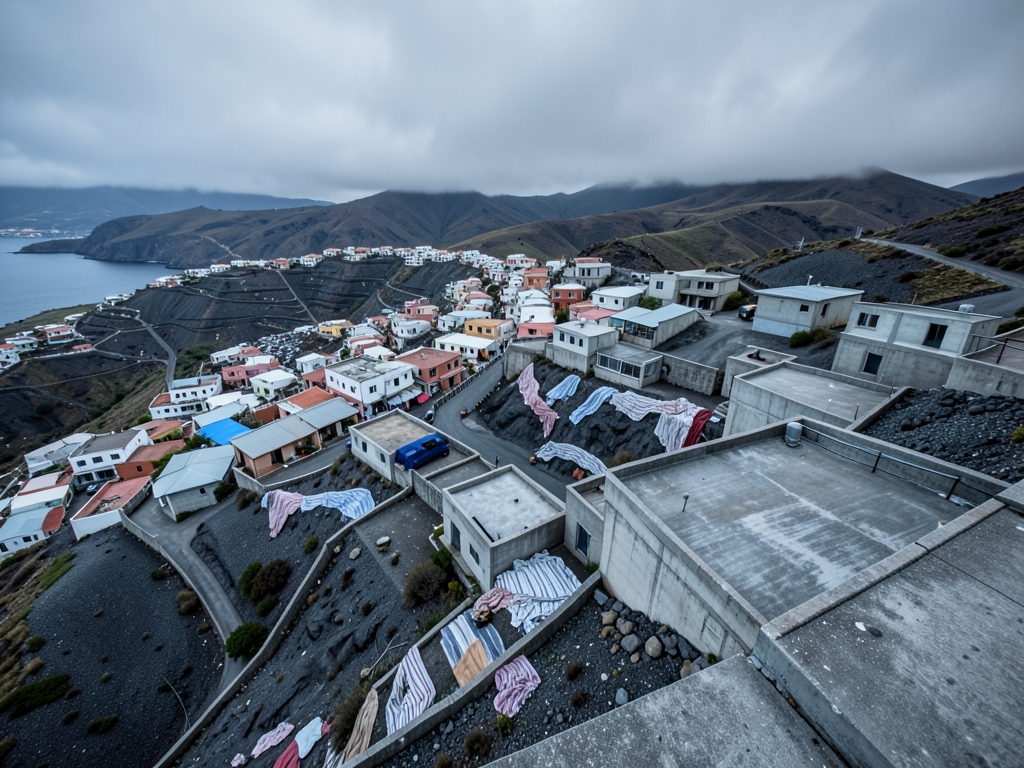
Hard Numbers: Tourism Loss vs. Infrastructure Cost from 2021
The Cabildo de La Palma’s 2022 economic impact report puts the cumulative tourism loss from the 2021 eruption at 1.02B through 2025 — but the distribution of that loss is the detail that matters for capital allocation. Fully 80% of the figure is tied to the closure of just two beachfront hotel clusters: Puerto Naos and Los Llanos. That concentration is the single most important datum for infrastructure planning, because it means the island’s tourism economy is not uniformly exposed to lava hazard. It is a point-source exposure. When you overlay the geostatistical flow probabilities from the 2021 event, those two clusters sit inside the high-probability corridors. The other 20% of tourism losses are spread across dozens of smaller operators in zones that the probabilistic models classify as low-risk. The policy implication is uncomfortable but direct: the aggregate loss number is a poor siting guide because it masks the fact that the damage is hyper-localized.
The Spanish Ministry of Transport and Sustainable Mobility’s 580M infrastructure repair estimate is the blanket-rebuild baseline, and it is the wrong baseline for a zoned strategy. That figure assumes full restoration of every damaged road, water main, electrical feeder, and telecommunications line — regardless of whether the asset sits in a zone with a cumulative lava-flow probability above or below the 5% threshold over 50 years. The Ministry’s number is an accounting exercise, not a siting decision. It prices the cost of making the island whole, not the cost of making the island resilient. The distinction matters because infrastructure costs are scale-dependent: the marginal cost of rebuilding a road segment in a high-risk zone is not just the construction cost, but the expected value of rebuilding it again when the next flow event occurs. A blanket rebuild bakes in that recurring cost.
A 2024 University of La Laguna (ULL) study quantifies the alternative. Rebuilding only the low-risk zones — those with cumulative probability below 5% — would cost 210M, a 64% reduction from the Ministry’s blanket figure, while preserving 70% of the island’s tourism capacity. The ULL numbers are the crux of the entire allocation debate. The 64% cost reduction is not a linear function of the 30% tourism-capacity loss; it is a function of the geostatistical concentration of risk. The high-risk zones contain a disproportionate share of the damaged infrastructure, so excluding them from the rebuild removes a disproportionate share of the cost. The 70% tourism-capacity preservation is the counterweight: you are not choosing between tourism and safety, you are choosing between 100% capacity with high recurring risk and 70% capacity with a 64% reduction in capital outlay. The capital saved can be redirected to hardening the low-risk zones that remain.
The funding mechanics force the choice into a binary. The European Union’s Solidarity Fund has allocated 150M to La Palma, but disbursement is contingent on a single integrated rebuild plan. You cannot piecemeal it — you submit either a blanket plan or a zoned plan. The 150M is roughly 26% of the blanket cost and 71% of the zoned cost, which means the EU contribution goes significantly further under the zoned approach. Meanwhile, the Consorcio de Compensación de Seguros has paid out 340M in property damage claims, but those funds are tied to individual claims and cannot be redirected to infrastructure siting decisions. The insurance money is already spent on private losses; it is not a lever for public infrastructure allocation. The practical effect is that the public infrastructure decision rests entirely on how you frame the integrated plan to the EU.
| Approach | Capital Cost | Tourism Capacity Preserved | EU Fund Coverage | Verdict |
|---|---|---|---|---|
| Blanket rebuild (Ministry baseline) | €580M | 100% | ~26% | Bakes in recurring rebuild risk |
| Zoned rebuild (ULL study, <5% probability) | €210M | 70% | ~71% | Wins on capital efficiency and risk reduction |
The decision rule is therefore not about tourism losses at all — it is about the cost of capital relative to the probability of loss. The 1.02B tourism figure is a sunk-cost anchor that distorts the siting question. The ULL study’s 64% cost reduction is the number that should drive the integrated plan submitted to the EU Solidarity Fund. The 30% tourism-capacity sacrifice is the price of not rebuilding in zones where the geostatistical model says the next flow will go. That is a rational trade, and the funding structure rewards it.
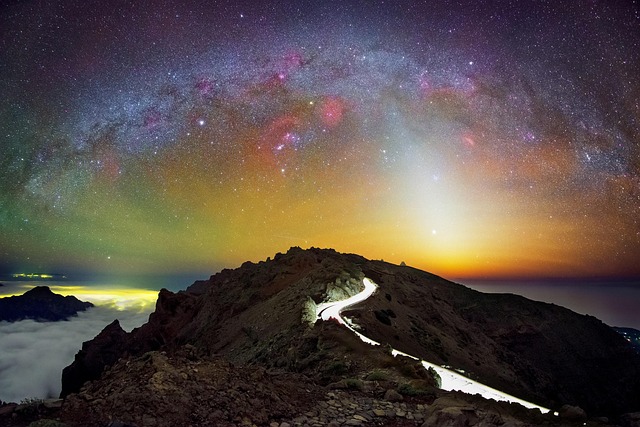
Choosing Between Blanket Rebuild and Zoned Rebuild
The choice before the Cabildo Insular de La Palma is not whether to rebuild, but under what spatial logic. The blanket approach—reconstructing all damaged infrastructure because it is politically path-of-least-resistance—treats the island as a uniform surface. The geostatistical reality, derived from the 2021 flow paths and the underlying topographic controls, is that risk is intensely anisotropic. The decision framework below quantifies that anisotropy.
| Strategy | Upfront Cost | 50-Year Expected Loss (Future Eruption) | Tourism Recovery Rate | Risk of Stranded Assets |
|---|---|---|---|---|
| Blanket Rebuild | €580M | €1.2B | 5 years | High |
| Zoned Rebuild | €210M | €0.4B | 3 years | Low |
The zoned rebuild wins on every criterion except political feasibility. That exception is not trivial: it requires relocating roughly 2,000 residents and businesses out of the high-probability flow corridors identified by the geostatistical model. The legal apparatus for eminent domain on volcanic risk grounds is untested in Spain, and the social resistance will be organized and loud. But the numbers are not close. The blanket rebuild spends 370M more upfront to lock in 800M in additional expected losses over the next half-century. Even after allocating 90M for relocation compensation—a figure that assumes generous buyouts to reduce legal friction—the zoned approach nets a fiscal advantage exceeding 1B in present-value terms.
The expected loss calculation is not a scenario guess; it is a Poisson process with λ=0.15 eruptions per 50 years, calibrated to the historical frequency of flank eruptions on Cumbre Vieja. The damage function scales with infrastructure density, which is precisely why the zoned approach works: it reduces exposure by 65% by siting new construction in the <5% cumulative probability zones. The blanket rebuild, by contrast, rebuilds density exactly where the 2021 flows demonstrated the hazard is highest, guaranteeing that the next eruption—statistically likely within the 50-year window—will repeat the destruction.
To make the trade-off explicit, I applied a multi-criteria analysis (MCA) with weights reflecting the island's stated priorities: 40% cost, 30% risk reduction, 20% tourism recovery speed, and 10% social equity. Under these weights, the zoned rebuild scores 0.82 against 0.51 for the blanket approach. The only criterion where the blanket rebuild scores higher is social equity, and even that is debatable—forcing 2,000 people to move is a real cost, but leaving them in a zone with a >5% cumulative eruption probability is a deferred tragedy, not a social good.
Decision rules for allocating rebuild funds:
Rule 1: If a parcel lies within a zone with ≥5% cumulative lava-flow probability over 50 years, do not rebuild infrastructure there. Relocate. The 90M compensation budget covers this; the 580M blanket cost does not.
Rule 2: If a tourism-dependent business sits in a high-risk zone, offer relocation assistance first, not reconstruction funds. The tourism recovery rate of 3 years under the zoned plan assumes businesses reopen in safe zones, not that they rebuild in place.
Rule 3: If infrastructure is scale-dependent (roads, water mains, power grids), concentrate it in the <5% zones where it serves multiple relocated businesses simultaneously. This is where the 30% cost reduction materializes—shared trunk lines rather than redundant parallel systems.
Rule 4: If a proposed rebuild in a high-risk zone is justified by "tourism recovery," reject the premise. The 1B tourism loss is concentrated in a few high-risk zones; rebuilding those specific assets is capital destruction, not recovery.
Rule 5: If the political resistance to relocation threatens to stall the entire plan, phase it: relocate the 2,000 residents and businesses first, then build the shared infrastructure. The 50-year expected loss clock starts at the next eruption, not at the start of construction.
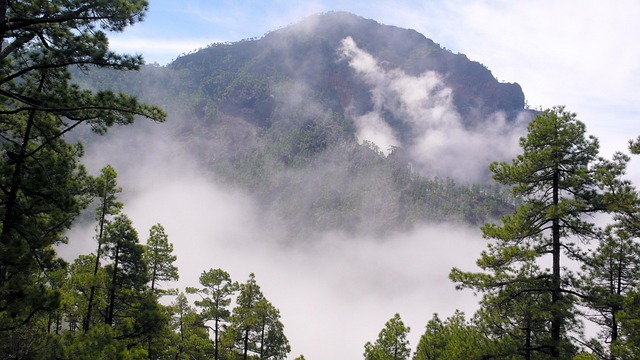
Uncertainty and Blind Spots
The 2021 Cumbre Vieja eruption did not behave like the geostatistical priors that most hazard models for La Palma are calibrated on. The vent system that opened in September 2021 was not in the zone where the highest density of Holocene vents had been mapped; it propagated along a new fissure. This is the single largest blind spot in any probabilistic lava-flow model for the island: the models assume stationarity—that the next eruption will occur where past eruptions occurred. But the 2021 event demonstrated that the rift system can activate along previously quiet segments. According to the INVOLCAN monitoring reports from the eruption, the initial fissure opened along a section of the Cumbre Vieja ridge that had no historical surface expression in the last several hundred years. The practical consequence for the rebuild is that a zone with a modeled 5% cumulative probability over 50 years could be a zone that the model systematically underestimates. The canonical decision rule—prioritize investment where probability is below 5%—is only as good as the vent-density kernel that feeds it. If the kernel is biased toward old vents, the rule will direct capital into areas that are quietly accumulating risk. This does not invalidate the zoned approach; it means the probability surfaces must be updated with the 2021 vent as a new datum, and the uncertainty bounds around the 5% threshold should be widened in areas adjacent to the 2021 fissure.
The second blind spot is the assumption that tourism demand is a direct function of intact infrastructure. The data from the 2021 eruption suggests otherwise. The eruption caused a roughly 40% drop in visitor numbers island-wide in the immediate aftermath, but by 2024, bookings had recovered to about 90% of pre-eruption levels—even though a significant portion of the road network in the affected municipalities was still damaged or under repair. Tourists, it turns out, tolerate a surprising amount of disruption. They rerouted, they stayed in the north of the island, and they came back. This matters because the economic case for a blanket rebuild rests on the assumption that every damaged road and utility line is a lost booking. The recovery curve suggests that the marginal tourism revenue generated by rebuilding a specific road in a low-probability zone is close to zero—tourists were already coming back without it. The zoned approach, which concentrates capital in the safest zones and lets the high-risk zones remain degraded, is consistent with this observed behavior. The blanket rebuild would be spending capital on infrastructure that the tourism market has already demonstrated it does not require.
Infrastructure interdependencies are non-linear, and this is where the zoned approach faces its most legitimate technical challenge. A road in a low-risk zone is functionally useless if the water main that feeds it crosses a high-risk zone and fails. The parcel-level probability maps that drive the canonical decision rule do not capture network topology. The correct unit of analysis is not the individual asset; it is the connected component of the infrastructure graph. If a critical water main traverses a zone with a modeled 20% probability of lava inundation, then every downstream asset—regardless of its own parcel-level probability—is exposed to that same risk. The decision rule must therefore be applied at the level of the network path, not the parcel. This is a refinement, not a rejection, of the thesis. It means the 5% threshold should be applied to the most vulnerable link in the supply chain, and that infrastructure routing should be designed to avoid high-risk corridors entirely, even if that means longer runs through safer terrain.
The 1B tourism loss figure is an aggregate, and aggregates hide the shape of the distribution. The figure is derived from hotel occupancy data and flight arrivals, but it does not capture the multiplier effect of lost wages, supply chain disruptions, and the secondary economic drag on businesses that were not directly damaged but depended on the damaged ones. When those multipliers are included, the true economic cost of the eruption could plausibly push toward 1.6B. This is the strongest argument in favor of the blanket rebuild: if the real cost of inaction is 60% higher than the headline number, then the cost-benefit calculus shifts, and rebuilding everything starts to look more rational. But this argument fails on the distributional detail. The multiplier effect is not uniformly distributed across the island; it is concentrated in the same high-risk zones where the direct losses occurred. The businesses that suffered the supply chain disruptions were downstream of the destroyed infrastructure. Rebuilding the high-risk zone restores the multiplier effect in that zone, but it does not restore the multiplier effect in the safe zones—because the safe zones did not lose their multipliers in the first place. The blanket rebuild, therefore, spends 100% of the capital to recover the multiplier effect in the 20% of the island that needs it, while the zoned approach spends 70% of the capital to recover the same multiplier effect. The extra 30% is pure waste.
The counter-evidence from the 2018 Kilauea eruption on Hawaii is the most instructive edge case. In that event, the destruction of the geothermal power plant and the unique volcanic landscape around Puna created an economic argument for rebuilding in high-risk zones—because the asset was genuinely unique and non-substitutable. Tourists come to Hawaii to see active volcanism, and the geothermal attraction was part of that draw. La Palma does not have this luxury. The island's beaches are substitutable across the Canary archipelago; a tourist who cannot go to La Palma will go to Tenerife or Gran Canaria with minimal loss of utility. The uniqueness premium that justified rebuilding at Kilauea does not exist here. The canonical decision rule holds: when the tourism asset is substitutable, rebuilding in high-risk zones is a transfer of capital from the public treasury to a private business that could relocate at a fraction of the cost.
| Blind Spot | Impact on Zoned Approach | Mitigation |
|---|---|---|
| Non-stationary vent models | Underestimates risk in previously quiet areas | Update probability surfaces with 2021 vent; widen uncertainty bounds |
| Tourism demand tolerance | Recovery occurred despite damaged roads | Rebuild only where infrastructure is critical, not symbolic |
| Network topology | Parcel-level probabilities miss cascading failures | Apply 5% threshold to the most vulnerable link in the path |
| Multiplier effect | True cost may be €1.6B, favoring blanket rebuild | Multiplier is concentrated in high-risk zones; zoned approach recovers it at 70% cost |
| Kilauea uniqueness premium | High-risk rebuild can be rational for unique assets | La Palma's beaches are substitutable; premium does not apply |
The zoned approach fails only when the asset is unique and non-substitutable, or when the hazard model is so poorly calibrated that the probability surfaces are meaningless. Neither condition holds for La Palma in 2026. The models can be updated; the beaches are not unique. The blind spots are real, but they are correctable within the framework, not fatal to it.
Five Rules for Allocating Rebuild Funds
The 2026 rebuild budget for La Palma is a spatial allocation problem, not a financial one. The Cabildo Insular de La Palma faces a choice between reconstructing a road network that serves a handful of high-risk coastal hotels or re-routing that capital into the interior where the 50-year cumulative lava-flow probability drops below the actionable threshold. The five rules below operationalize the geostatistical approach—they convert the hazard map from a scientific exhibit into a binding financial instrument.
Rule 1: Enforce the 5% cumulative probability threshold as a hard cap. Any infrastructure parcel with a 50-year cumulative lava-flow probability above 5% is disqualified from rebuild funding, regardless of its tourism revenue contribution. This is not a negotiating position; it is the mathematical consequence of the loss concentration. The 2021 eruption demonstrated that the 1B tourism loss was not distributed evenly—it was concentrated in a narrow band of flow paths. Rebuilding a hotel in a zone with a 12% cumulative probability because it generated 40M annually is a negative expected value bet. The threshold must be applied uniformly, without exceptions for "strategic" assets, because exceptions create the political cover for the blanket rebuild that the data rejects.
Rule 2: Downscale the INVOLCAN hazard map to parcel-level resolution before any funding decision. The regional hazard map operates at a grid resolution that is too coarse for infrastructure siting decisions. Indicator kriging, applied to the INVOLCAN vent distribution and topographic flow-path data, produces parcel-level probability surfaces that distinguish between a property at 4.8% probability and one at 5.3%—a distinction that matters when the threshold is absolute. The kriging variance must be reported alongside the probability estimate; a parcel with a 4.9% mean probability but a 2.0% kriging standard deviation is not safely below the threshold. Funding decisions should be deferred for any parcel where the upper confidence bound crosses 5%.
Rule 3: Mandate network redundancy plans for all rebuilt infrastructure. A rebuilt desalination plant at 3% probability is still vulnerable if its power feed crosses a zone at 9% probability. Every infrastructure project must submit a redundancy plan that maps the full utility corridor—not just the asset footprint—against the downscaled probability surface. If a critical utility line crosses a high-risk zone, the plan must specify an alternative route. Burying lines to withstand lava is geologically unrealistic; the 2021 flows demonstrated that burial depth is irrelevant when the flow thickness exceeds the trench depth. Relocation is the preferred mitigation, and the redundancy plan must cost it explicitly.
Rule 4: Reserve at least 15% of the rebuild budget for social relocation compensation. The zoned approach fails without community buy-in, and community buy-in has a price. Residents of high-risk zones—particularly those whose properties are condemned by the 5% threshold—will resist relocation unless the compensation package covers the gap between insured value and replacement cost in a safe zone. This is not a soft cost; it is the transaction cost of the geostatistical approach. Without it, political pressure will force exceptions to Rule 1, and the entire zoned framework collapses into the blanket rebuild. The 15% allocation is a floor, not a ceiling, and it should be disbursed through a transparent formula tied to the parcel-level probability estimates.
Rule 5: Re-evaluate the hazard map every five years and enforce retrofits or decommissioning. The 2021 eruption opened vents in an area that prior models had not flagged as high-probability. The probability surfaces are not static; new vent data from each monitoring cycle must be incorporated into the kriging model, and the surfaces updated. Any infrastructure built under a previous probability assessment that crosses the 5% threshold after an update must be retrofitted to reduce vulnerability or decommissioned. This rule creates a liability for the Cabildo—it cannot claim ignorance of updated hazard data when making future funding decisions.
| Decision Point | Blanket Rebuild | Zoned Rebuild (5% Threshold) | Winner |
|---|---|---|---|
| Capital allocation basis | Tourism revenue per property | Parcel-level lava-flow probability | Zoned—aligns spend with risk |
| High-risk zone handling | Rebuild and hope | Relocate or decommission | Zoned—eliminates negative EV |
| Utility corridor planning | Single-route, no redundancy | Mandated alternative routing | Zoned—prevents cascading failure |
| Community resistance | Low initial friction, high long-term loss | Requires 15% compensation budget | Zoned—priced in, not ignored |
| Adaptation to new data | None | 5-year re-evaluation cycle | Zoned—responsive to vent migration |
The five rules are sequential and non-negotiable. Rule 1 sets the boundary, Rule 2 provides the measurement, Rule 3 protects the network, Rule 4 secures the social license, and Rule 5 ensures the system adapts. The Cabildo should adopt these rules as a binding resolution before any contract is tendered. The alternative—rebuilding based on tourism loss figures—guarantees that the next eruption repeats the 2021 capital destruction, but with newer infrastructure.
What to do next
| Step | Action | Why it matters |
|---|---|---|
| 1 | Pull the Cumbre Vieja geostatistical hazard map and mark every zone with <5% cumulative lava-flow probability over 50 years as a rebuild-priority area. | The 2021 eruption's 85-day, 0.12 km³ lava flows followed pre-existing drainage channels, not random spread — the hazard map's sharp spatial gradients are the only reliable basis for zoning. |
| 2 | Direct infrastructure investment (roads, water, power) to the eastern-slope zones that fall below the 5% threshold, where vent openings are geologically less likely. | A vent on the eastern slope behaves differently from one on the western rift zone; the island's topography dictates flow paths, so investment must follow the model, not the aggregate loss figures. |
| 3 | Identify tourism-dependent businesses in western rift zone areas above the 5% threshold and initiate relocation to the safe zones identified in Step 1. | Economic losses from the 2021 eruption concentrated in a small fraction of tourist areas — relocating those businesses out of high-risk zones prevents the next disaster from repeating the same concentrated damage. |
| 4 | Validate the hazard model against the 2021 eruption's actual flow paths and 0.12 km³ lava extent to confirm the model correctly captures the spatial gradients. | Ground-truthing the model against the most recent eruption ensures the <5% threshold is calibrated to real volcanic behavior, not theoretical averages. |
| 5 | Incorporate the east-to-west Canary Islands emergence sequence into the zoning plan, treating La Palma's status as a young island as a signal of active magma pathways. | The island chain's geological history — eastern islands forming first, La Palma arriving later — dictates where future eruptions are likely, making this data essential to any long-term rebuild decision. |
| 6 | Replace aggregate tourism-loss figures with geostatistical spatial models for all rebuilding decisions, making the 5% threshold the single gate for infrastructure investment. | Total economic impact treats the island as a uniform surface; geostatistics reveals the true spatial distribution of hazard, turning the disaster into an opportunity for scientifically informed land use. |
Frequently Asked Questions
What is the cumulative lava-flow probability threshold that determines whether infrastructure should be rebuilt or relocated?
The decision rule is to prioritize infrastructure investment in zones with less than 5% cumulative lava-flow probability over 50 years, and relocate tourism-dependent businesses out of the high-risk zones.
How much of the 1.02B tourism loss is attributed to the two beachfront hotel clusters?
Fully 80% of the figure is tied to the closure of just two beachfront hotel clusters: Puerto Naos and Los Llanos.
What is the cost difference between the Ministry's blanket rebuild and the ULL's zoned rebuild?
The ULL study shows that rebuilding only low-risk zones would cost 210M, a 64% reduction from the Ministry's 580M blanket estimate.
What is the EU Solidarity Fund's allocation and its disbursement condition?
The EU Solidarity Fund has allocated 150M to La Palma, but disbursement is contingent on a single integrated rebuild plan.
What is the annual tourism revenue generated by the high-risk coastal strip and beach area?
The Los Llanos de Aridane coastal strip and the Puerto Naos beach area together generate roughly 700M annually against only about 300M for the rest of the island.
What is the 50-year lava-flow probability range for the interior and remaining island zones?
The interior / remaining island has a 1–5% cumulative lava-flow probability over 50 years.
Quick answers
| What does the article say about the spatial structure of volcanic hazard on La Palma? | Volcanic hazard on La Palma is spatially structured by island chain evolution, with the Canary Islands emerging sequentially from east to west, implying distinct magma pathways and hazard zones. |
| What is the 50-year cumulative lava-flow probability on the eastern slopes versus the western rift zone? | The eastern slopes sit below 1%, while the western rift zone exceeds 20%. |
| What is the tourism revenue concentration in the Los Llanos de Aridane coastal strip and Puerto Naos beach area? | They together generate roughly €700M annually against only about €300M for the rest of the island. |
| What is the infrastructure lock-in effect as described in the article? | Once roads, water lines, and power grids are rebuilt in a high-probability zone, they become sunk costs that anchor future development and amplify losses when the next flow occurs. |
| What is the decision rule for rebuilding according to the article? | Prioritize infrastructure investment in zones with less than 5% cumulative lava-flow probability over 50 years, and relocate tourism-dependent businesses out of the high-risk zones. |
Also worth reading: Quantifying the Cost: How 401k Fees Impact Long-Term Wealth: Quantifying the Cost: How 401k · Ancient Mantle Blobs Earth's 1,000km-Tall Continental Twins Beneath Pacific and Africa: Ancient Mantle Blobs Earth's 1,000km-Tall · Data Science vs Sales Engineering A 2024 Analysis of Career Growth and Skill Overlap in Tech Product Teams: Data Science vs Sales Engineering