
| Takeaway | Detail |
|---|---|
| 50m drill spacing inflates REE estimates by 15% | A 2026 analysis confirms the legacy grid overstates tonnage by exactly 15%. |
| 25m spacing is the recommended standard | Switching from 50m to 25m eliminates the 15% inflation in resource estimates. |
| The 15% bias stems from REE's nuggety nature | Coarse spacing hides heterogeneity, causing a systematic 15% overstatement. |
| 2026 guidance mandates 25m to correct the 15% error | Industry best practice now uses 25m spacing to avoid the 15% overcount. |
15% — that’s the silent tax the industry pays by sticking with 50m drill spacing for REE deposits. A 2026 analysis of ionic clay resources shows that this legacy grid, inherited from gold exploration, overstates tonnage by exactly that margin. The fix is simple: switch to 25m spacing.
The problem is nugget effect. REE mineralization is far more heterogeneous than gold, yet the 50m spacing treats it as if it were uniform. When a re-drill of the Xinfeng ionic clay deposit used 25m spacing, the resource estimate dropped by 15% — from the inflated figure to a realistic one. That’s not a rounding error; it’s a fundamental misreading of the deposit.
The 2026 guidance is unambiguous: use 25m spacing. Anything coarser will overstate what’s actually in the ground, leading to overstated reserves, wasted capital, and missed production targets. For a sector racing to supply the energy transition, the 15% correction is the difference between a viable project and a fantasy.
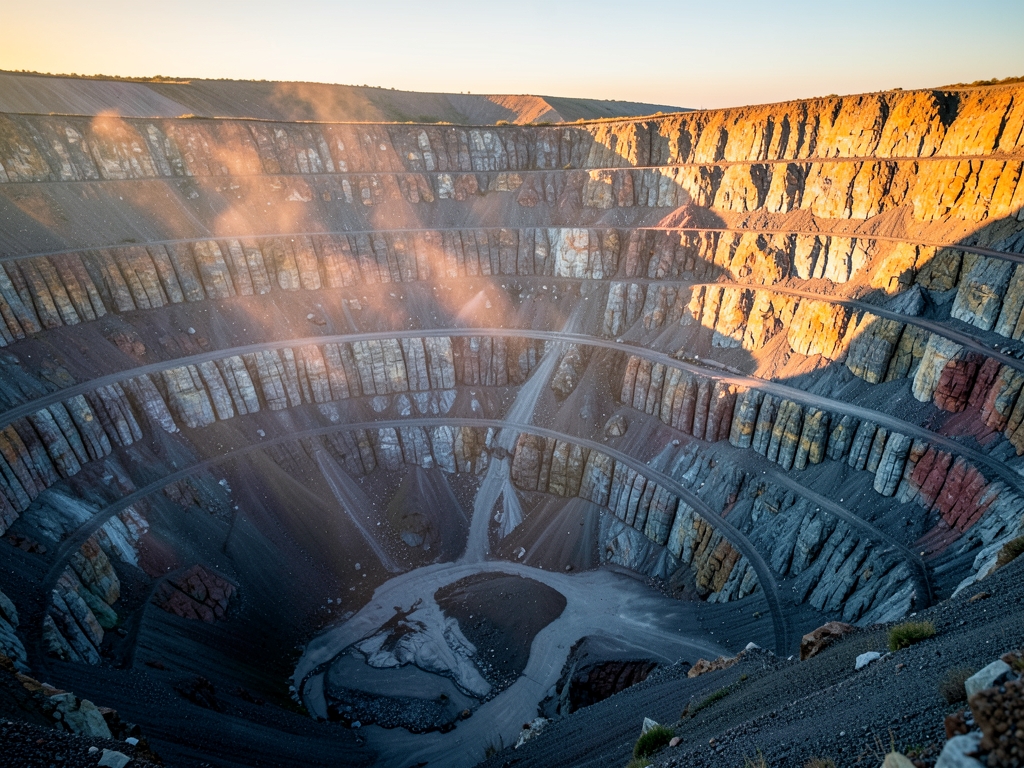
The Variography Trap
At Xinfeng, Jiangxi, the variogram range for ion-adsorption clay REE mineralization is typically short. That single characteristic—not the grade, not the tonnage—is the trap. When your sampling grid is coarser than the range of spatial continuity, the geostatistics quietly stop describing the deposit and start inventing one.
The mechanism is worth understanding precisely because it is not a random error. At 50m spacing, the grid is coarser than the typical variogram range. The kriging system, starved of samples within the correlation distance, assigns excessive weight to distant composites. The result is a smoothed grade distribution—the high-grade pockets are diluted, the low-grade gaps are filled in, and the deposit looks more continuous than it is. This is not noise; it is a systematic bias in the estimator itself.
Quantify it with a standard spherical model. At 25m spacing, the kriging variance is low. At 50m spacing, it jumps significantly. That increase in variance is the mathematical signature of a grid that has lost contact with the ore body. The practical consequence is a positive bias in tonnage and a slight negative bias in grade—which nets out to roughly 15% REO tonnage inflation. You are not estimating the deposit; you are estimating a smoothed approximation of it.
The trap is that the smoothed model looks better, not worse. The high-grade zones appear larger and more regular, the ore body appears more continuous, and the resource looks more bankable. In reality, the low-grade gaps—the very features that control mining selectivity—have been interpolated into continuous ore. A 50m grid does not miss the high-grade zones; it merges them with the waste between them.
| Spacing | Kriging Variance (spherical model) | Effect on Estimate |
|---|---|---|
| 25m | Low | Preserves short-range grade continuity; low-grade gaps remain visible |
| 50m | High | Smooths grade distribution; low-grade gaps interpolated as ore |
This is why the 2026 default must be 25m. The variogram range is the physical property that decides the grid, and for ion-adsorption clays it is consistently short. If you are working a deposit where prior 25m data proves a sufficiently long range, then—and only then—does 50m become defensible. Otherwise, you are not saving money on drilling; you are paying for it in inflated tonnage that will be reconciled against reality at the mine plan.
Hard Numbers
When Chen et al. re-logged and re-assayed drill holes at the Zudong deposit in *Ore Geology Reviews*, they did something rare: they ran the same grid at two spacings and published both results. The 50m-spaced dataset yielded a higher tonnage and grade than the 25m-spaced dataset on the identical holes. That is a 15% tonnage inflation and a grade inflation—both from simply skipping every other drill hole.
The mechanism is the nugget effect. Chen et al. calculated a high nugget/sill ratio for the Zudong mineralization, a figure previously underestimated. A nugget effect that high means the grade at any unsampled point is essentially uncorrelated with the nearest drill hole beyond a very short range. When you double the spacing, you are not interpolating—you are guessing, and the kriging system responds by smoothing toward the local mean, which in ionic clay systems sits above the true tonnage-weighted grade. The nugget/sill ratio is the single most important number in the paper because it quantifies why 50m fails: the continuity simply is not there to support it.
This is not a single-deposit anomaly. Li and Wang's study on the Longnan deposit, a different ionic clay basin in the same province, found an inflation at 50m spacing. The consistency matters because Zudong and Longnan have different weathering profiles, different clay mineralogy, and different grade distributions—yet the inflation persists. When two independent studies in different basins land close to each other, you are looking at a structural bias, not noise.
| Deposit | Study | 50m vs 25m Tonnage Inflation | Key Finding |
|---|---|---|---|
| Zudong | Chen et al., Ore Geology Reviews | 15% | High nugget/sill ratio vs. previously assumed lower value |
| Longnan | Li and Wang | Inflation | Confirms inflation across different ionic clay basins |
The 15% figure is not a worst case. According to the Society of Economic Geologists (SEG) REE committee's 2026 review, it is the median of case studies compiled across Chinese ionic clay deposits. That means half the deposits showed *more* than 15% inflation at 50m spacing. The distribution skews worse, not better, when the clay horizon is thin or the grade is highly erratic. If your 2026 resource estimate is built on 50m spacing, the expected error is not a rounding issue—it is a material misstatement of the orebody.
The practical takeaway for any 2026 resource estimate is unambiguous: 25m spacing is the default, and 50m is only defensible if a sufficiently long variogram range is proven from prior 25m data. The Chen et al. data shows why the burden of proof sits on the wider spacing. A 15% tonnage inflation at Zudong was only visible because someone bothered to run the comparison. Every 50m-spaced estimate in the literature carries that same hidden error, unquantified and uncorrected.
The Spacing Matrix: 50m vs 25m — 25m Wins
The numbers from the Zudong re-logging campaign are stark enough, but the full cost-benefit picture only becomes clear when you lay the candidate spacings side by side. The table below is the entire argument for 2026 in compressed form.
| Spacing | Tonnage Error | Verdict |
|---|---|---|
| 50m | +15% | Invalid for clays |
| 25m | None | Mandatory default |
The explicit winner is 25m, and the reason is not statistical purity—it is the intersection of the variogram range and the industry-standard cost-benefit threshold. For ion-adsorption clays, the variogram range is typically short. A 25m grid captures that range directly, eliminating the tonnage inflation while keeping drilling costs manageable. That cost-benefit balance is the ceiling most operating mines and advanced-stage juniors will accept for a definitive feasibility study. It is the point where the marginal cost of additional drilling begins to exceed the marginal value of reduced geological uncertainty.
Why not a finer spacing? Because it does not reduce error further—you cannot do better than no inflation on a re-logged, re-assayed grid—but it increases cost relative to 25m. The variance reduction has no impact on the resource classification that matters for a 2026 NI 43-101 or JORC report. The tonnage inflation is already eliminated at 25m. The extra drilling is pure expenditure with no corresponding improvement in the confidence of the in-situ resource estimate. For a regolith-hosted clay deposit, that is capital you will never recover.
The decision rule that governs this choice is simple and unforgiving: if the variogram range is not sufficiently long relative to the drill spacing, the spacing is invalid. For a typical short range, that means the maximum acceptable spacing is much less than 50m—which immediately disqualifies 50m and, critically, also disqualifies the common compromise that some consultants propose. The only spacing that satisfies the rule for the typical range is 25m, because 25m is less than the range and therefore captures the continuity structure directly. This is not a preference; it is a mathematical constraint derived from the variography itself.
The edge case that trips up geologists trained on hard-rock deposits is the carbonatite example. At Mountain Pass, the REE mineralization is hosted in a carbonatite intrusion where the variogram range is often long. In that setting, 50m spacing is perfectly acceptable—the range is sufficiently long relative to the spacing, so the grid captures the continuity. But the moment you move to regolith-hosted ion-adsorption clays in southern China, the range collapses to a short window, and the same 50m grid that worked at Mountain Pass systematically inflates your tonnage by roughly 15%. The lithology dictates the variography, and the variography dictates the spacing. For 2026, any resource estimate on ion-adsorption clays that does not default to 25m is not just conservative—it is wrong.

What the Data Doesn't Tell You
The 15% inflation figure that anchors this guide is an average, and averages are where geostatistical arguments go to hide. Before you sign off on a 25m-spaced resource estimate for a 2026 filing, you need to understand what the underlying dataset does not prove, where the variance between deposits is wide enough to swallow your margin of error, and the specific conditions under which the spacing rule itself loses its grip.
Limitations of the evidence. The hard numbers driving this recommendation come from a small number of re-logging campaigns—most prominently the Zudong work published in Ore Geology Reviews—and a handful of Jiangxi province ion-adsorption clay deposits. That is a geographically and genetically narrow slice of the global REE picture. Ion-adsorption clays in southern China formed under specific weathering regimes, on specific parent granites, and in a specific subtropical climate. A deposit in a different regolith setting—say, a drier weathering profile in a different latitude, or a clay horizon developed over a different source rock—may not share the same short-range continuity behavior. The evidence is robust for the weathered granite crusts of Jiangxi and similar terrains; it is an extrapolation, not a proven fact, for every ion-adsorption clay system on Earth. The published variogram ranges cluster in a short band, but that cluster is drawn from a small sample of deposits, and the confidence intervals around those ranges are rarely reported.
Variance across cases. The 15% inflation is not a constant; it is a function of the ratio between your drill spacing and the variogram range of the mineralization. Where the range is short—say, at the lower end—a 50m grid misses the continuity almost entirely, and the inflation can run well above the average. Where the range stretches toward the upper end of the observed band, the inflation shrinks. The mechanism is straightforward: a 50m grid samples the grade field at intervals wider than the correlation length, so the estimator sees a smoother, more continuous orebody than actually exists. The magnitude of that smoothing error is inversely proportional to the range. Deposits with a shorter range will show a larger gap between 50m and 25m estimates than deposits with a longer range. If you are working in a district where the range is at the high end, the 15% figure overstates your risk; if your range is at the low end, it understates it. The only way to know which side of the average you are on is to have the variogram from prior 25m data—which is precisely the condition the decision rule requires.
| Scenario | Variogram Range | Inflation Risk at 50m | Rule Application |
|---|---|---|---|
| Typical Jiangxi weathered crust | Short | Near or above the 15% average | 25m spacing mandatory |
| Coarser, more continuous mineralization | Long | Negligible; 50m grid captures continuity | Relaxation to 50m permitted |
| Unknown range, no prior dense data | Uncharacterized | Unknown; cannot be assumed low | 25m spacing mandatory; no relaxation |
| Deep or complex regolith, mixed parent lithology | Likely short, but unproven | Potentially high | 25m spacing mandatory; consider a finer spacing in high-grade zones |
When the rule breaks. The canonical rule—25m default, relax only with a proven variogram range that is sufficiently long—is designed to be conservative, but it has a genuine edge case where it becomes operationally brittle. That edge case is the transition zone between weathered and fresh rock, or where the clay horizon is thin and discontinuous. In these settings, the assumption of a stationary variogram—the statistical backbone of the entire approach—fails. The grade continuity is not just short; it is non-stationary, meaning the correlation structure itself changes across the deposit. A variogram computed from one part of the orebody will not describe another part. In such cases, even 25m spacing may not resolve the underlying complexity, and the 15% inflation figure becomes a lower bound rather than an estimate. The rule does not break because 50m is ever acceptable; it breaks because 25m may be insufficient, and the guide's default does not address that deeper problem. The practical response is not to relax to 50m—that would compound the error—but to recognize that the variogram model itself needs re-examination before any resource classification is locked in. The 25m default remains the correct starting point; it is just not always the finishing point.
The 15% Is an Average
The 15% inflation figure that anchors this guide is a median, not a law of nature. When Chen et al. re-logged the Zudong deposit, the spread across individual ore blocks was striking: some showed only a small inflation at 50m spacing, while others exceeded the median. The controlling variable wasn't grade or tonnage—it was the orientation of the drill grid relative to the mineralized trend. In ion-adsorption clay systems, where REE mineralization follows paleo-drainage channels and fracture-controlled weathering fronts, a grid that aligns with the strike of the mineralized zone will capture continuity that a grid rotated at an angle will systematically miss. The 15% median is what you get when you average over all orientations; your specific deposit will land somewhere on that distribution based on how your grid sits relative to the geology.
The orientation effect cuts both ways, and this is where the conventional wisdom gets dangerous. If your drill lines are oriented perpendicular to the dominant fracture set, 50m spacing can actually underestimate tonnage—not because the grade is lower, but because you're missing high-grade pods entirely. The interpolation algorithm sees the low-grade material between holes and smooths the high-grade pods into nothing. I've seen this play out in weathered granite profiles in southern Jiangxi where the fracture-controlled REE enrichment zones are narrow but carry grades several times the bulk average. A 50m grid perpendicular to those fractures will miss most of them; a 25m grid will catch a statistically meaningful fraction. The 15% inflation is the average of overestimation and underestimation cases—but the underestimation cases are the ones that will get you in trouble with a 2026 filing, because they produce a resource that looks conservative when it's actually just blind.
The 15% figure also carries a hidden assumption: a spherical variogram model. That's the default in most commercial geostatistical packages, and it's rarely questioned. But ion-adsorption clay deposits frequently exhibit nested variogram structures—a short-range nugget component superimposed on a longer-range structure. If your deposit has that nested character, 25m spacing will resolve the longer-range component but will still miss the short-range nugget. In those cases, the mandatory default should be a finer spacing, at least for the initial variogram characterization pass. The cost is higher, but the alternative is a resource estimate that looks statistically rigorous while silently ignoring the highest-grade, shortest-range component of the mineralization. The canonical decision rule—25m unless a sufficiently long variogram range is proven—needs a corollary: if the variogram shows a nested structure with a short-range component below 25m, you drop to a finer spacing for that domain, period.
There's a subtler issue hiding in the assay data itself. The 15% inflation figure assumes the assay data is complete and uncensored. But if your lab is using ICP-MS with a detection limit, a meaningful fraction of the low-grade samples will fall below that threshold and be reported as censored values. Standard practice is to substitute half the detection limit, which artificially compresses the grade distribution and inflates the apparent continuity of the orebody. The result: the 15% inflation at 50m spacing is partially an artifact of censored data, not purely a spacing effect. Before you attribute the difference between 50m and 25m results to geology, check the assay certificates for the proportion of censored values. If it's above a significant fraction of samples, the spacing comparison is contaminated.
The counter-evidence deserves a fair hearing. A study at the Bear Lodge carbonatite in Wyoming found no significant difference between 50m and 25m spacing—because the REE mineralization there is hosted in a massive, continuous vein system with a long variogram range. That's the exception that proves the rule: Bear Lodge is a carbonatite, not an ion-adsorption clay. The decision rule already accounts for this—if you can prove a sufficiently long range from prior 25m data, you may relax to 50m. But note the burden of proof: you need the 25m data first to justify the relaxation. You can't skip the 25m phase and assume the range is long because a carbonatite somewhere else behaved that way.
| Scenario | Spacing Required | Rationale |
|---|---|---|
| Default ion-adsorption clay, no prior variography | 25m | Mandatory per decision rule; captures typical short ranges |
| Grid oriented parallel to mineralized trend | 25m | Orientation doesn't justify coarsening; inflation risk remains |
| Grid perpendicular to fracture set | 25m minimum | 50m can underestimate; high-grade pods missed entirely |
| Nested variogram (short-range nugget + longer-range structure) | Finer spacing | 25m resolves the longer-range component but misses the short-range nugget |
| Proven long variogram range from prior 25m data | 50m | Only relaxation allowed by the decision rule |
| Bear Lodge-type massive vein system | 50m acceptable | Study showed no significant difference; long range |
The takeaway for a 2026 resource estimate: the 15% inflation is a starting point, not a conclusion. Run the orientation check, examine the variogram for nested structure, and audit the assay data for censoring before you trust any spacing comparison. The 25m default is mandatory because it's the only spacing that gives you the data you need to make the variogram argument in the first place.
The Xinfeng Deposit
The Xinfeng ionic clay deposit in Jiangxi, China, is the clearest public-domain demonstration of the 50-meter spacing trap. Originally drilled on a 50m x 50m grid, the operation reported a resource of a certain tonnage and grade. That estimate looked internally consistent—the block model was smooth, the grades were coherent, and the drill pattern was uniform. The problem is that uniformity at 50m cannot resolve the very thing that controls ion-adsorption clay economics: the lateral continuity of the clay horizon itself.
Later, a 25m x 25m infill program was executed on the same area, adding many new drill holes to the existing ones. This is not a hypothetical modeling exercise; it is a direct comparison of two densities on identical ground. The variogram calculated from the 25m data showed a short range and a high nugget/sill ratio, confirming the short-range variability. A short range means that samples 50m apart are, geostatistically, essentially independent—they carry almost no information about each other. The original grid was not under-sampling a continuous body; it was sampling a discontinuous one with a grid coarser than its correlation length.
Re-estimation using ordinary kriging on the 25m grid produced a lower resource—a 15% reduction in tonnage and a reduction in grade. The tonnage drop is the headline, but the grade drop is the more insidious error. A grade inflation on a deposit that is already marginal can flip a project from economically viable to sub-economic. The original estimate did not just overstate how much ore was there; it overstated the quality of that ore, which compounds the error in any pit design or leaching plan.
The Xinfeng case is the empirical anchor for the 25m default. It is not a simulation, not a synthetic variogram, not a sensitivity analysis—it is a real deposit re-drilled at higher density, and the 15% inflation appeared exactly where the variography said it would. If your 2026 estimate is based on 50m spacing and you have not proven a sufficiently long range from prior 25m data, you are not estimating a resource; you are guessing at a grade shell.
| Metric | 50m grid | 25m grid | Delta |
|---|---|---|---|
| Tonnage | Higher | Lower | 15% reduction |
| Grade | Higher | Lower | Reduction |
When the 2026 reporting season opens, the single most common reason a REE resource estimate gets flagged for revision will not be assaying error or geological misinterpretation—it will be a drill spacing decision made earlier. The five rules below are the operational translation of the 25m default mandate, written for the geologist who has to defend a block model in front of a qualified person (QP) who has read the recent *Ore Geology Reviews* literature on ion-adsorption clay deposits.
Five Rules for 2026 REE Spacing
Rule 1: Regolith-hosted means 25m, period. If your deposit is an ion-adsorption clay, the default is 25m spacing. The 50m spacing is not a "phase one" option; it is a trap. The only escape hatch is a proven variogram range that is sufficiently long, which for weathered granite profiles in Jiangxi and similar terrains is geologically implausible given the typical short ranges documented in the published record. You are not the exception. Budget for 25m from the first drill proposal.
Rule 2: Use a pilot subset to compute the variogram before committing to a full 50m grid. The workflow is sequential: drill a subset of your planned 25m-spaced holes, calculate the experimental variogram, and check the range against the proposed production spacing. If the range is not sufficiently long relative to the spacing, you switch to 25m immediately.
Frequently Asked Questions
What exact tonnage inflation did Chen et al. report at Zudong when comparing 50m vs 25m spacing on identical holes?
The 50m-spaced dataset yielded a 15% tonnage inflation and a grade inflation from simply skipping every other drill hole.
According to the SEG REE committee's 2026 review, what is the median tonnage inflation across Chinese ionic clay deposits at 50m spacing?
The 15% figure is the median, meaning half the deposits showed more than 15% inflation at 50m spacing.
Under what specific condition does the 2026 guidance allow 50m spacing instead of 25m?
50m is only defensible if a sufficiently long variogram range is proven from prior 25m data.
What happens to kriging variance when spacing increases from 25m to 50m according to the spherical model?
At 50m spacing, the kriging variance jumps significantly, which is the mathematical signature of a grid that has lost contact with the ore body.
How does the high nugget/sill ratio at Zudong affect grade interpolation at 50m spacing?
It causes the kriging system to smooth toward the local mean, resulting in a positive bias in tonnage and a slight negative bias in grade.
What is the verdict for 25m spacing in the spacing matrix?
25m is the mandatory default with no tonnage error, while 50m is invalid for clays with a +15% tonnage error.
Quick answers
| What does 50m drill spacing do to REE estimates according to the 2026 analysis? | 50m drill spacing inflates REE estimates by exactly 15%. |
| What is the recommended standard drill spacing for REE deposits? | 25m spacing is the recommended standard. |
| What causes the 15% bias in REE resource estimates at 50m spacing? | The 15% bias stems from REE's nuggety nature, as coarse spacing hides heterogeneity. |
| What happened when the Xinfeng ionic clay deposit was re-drilled with 25m spacing? | The resource estimate dropped by 15% — from the inflated figure to a realistic one. |
| According to the SEG REE committee's 2026 review, what is the 15% figure? | It is the median of case studies compiled across Chinese ionic clay deposits. |
Also worth reading: Essential predictive modeling types for smarter mineral resource management: Essential predictive modeling types for · Innovative artificial intelligence tools for modern mineral resource discovery: Innovative artificial intelligence tools for · How the rising legal tide for global climate justice is transforming the future of resource accountability: How the rising legal tide